Showing years to the Developer Dashboard Charts UI
We’ve done a minor enhancement to the charts UI in the Developer Dashboard.
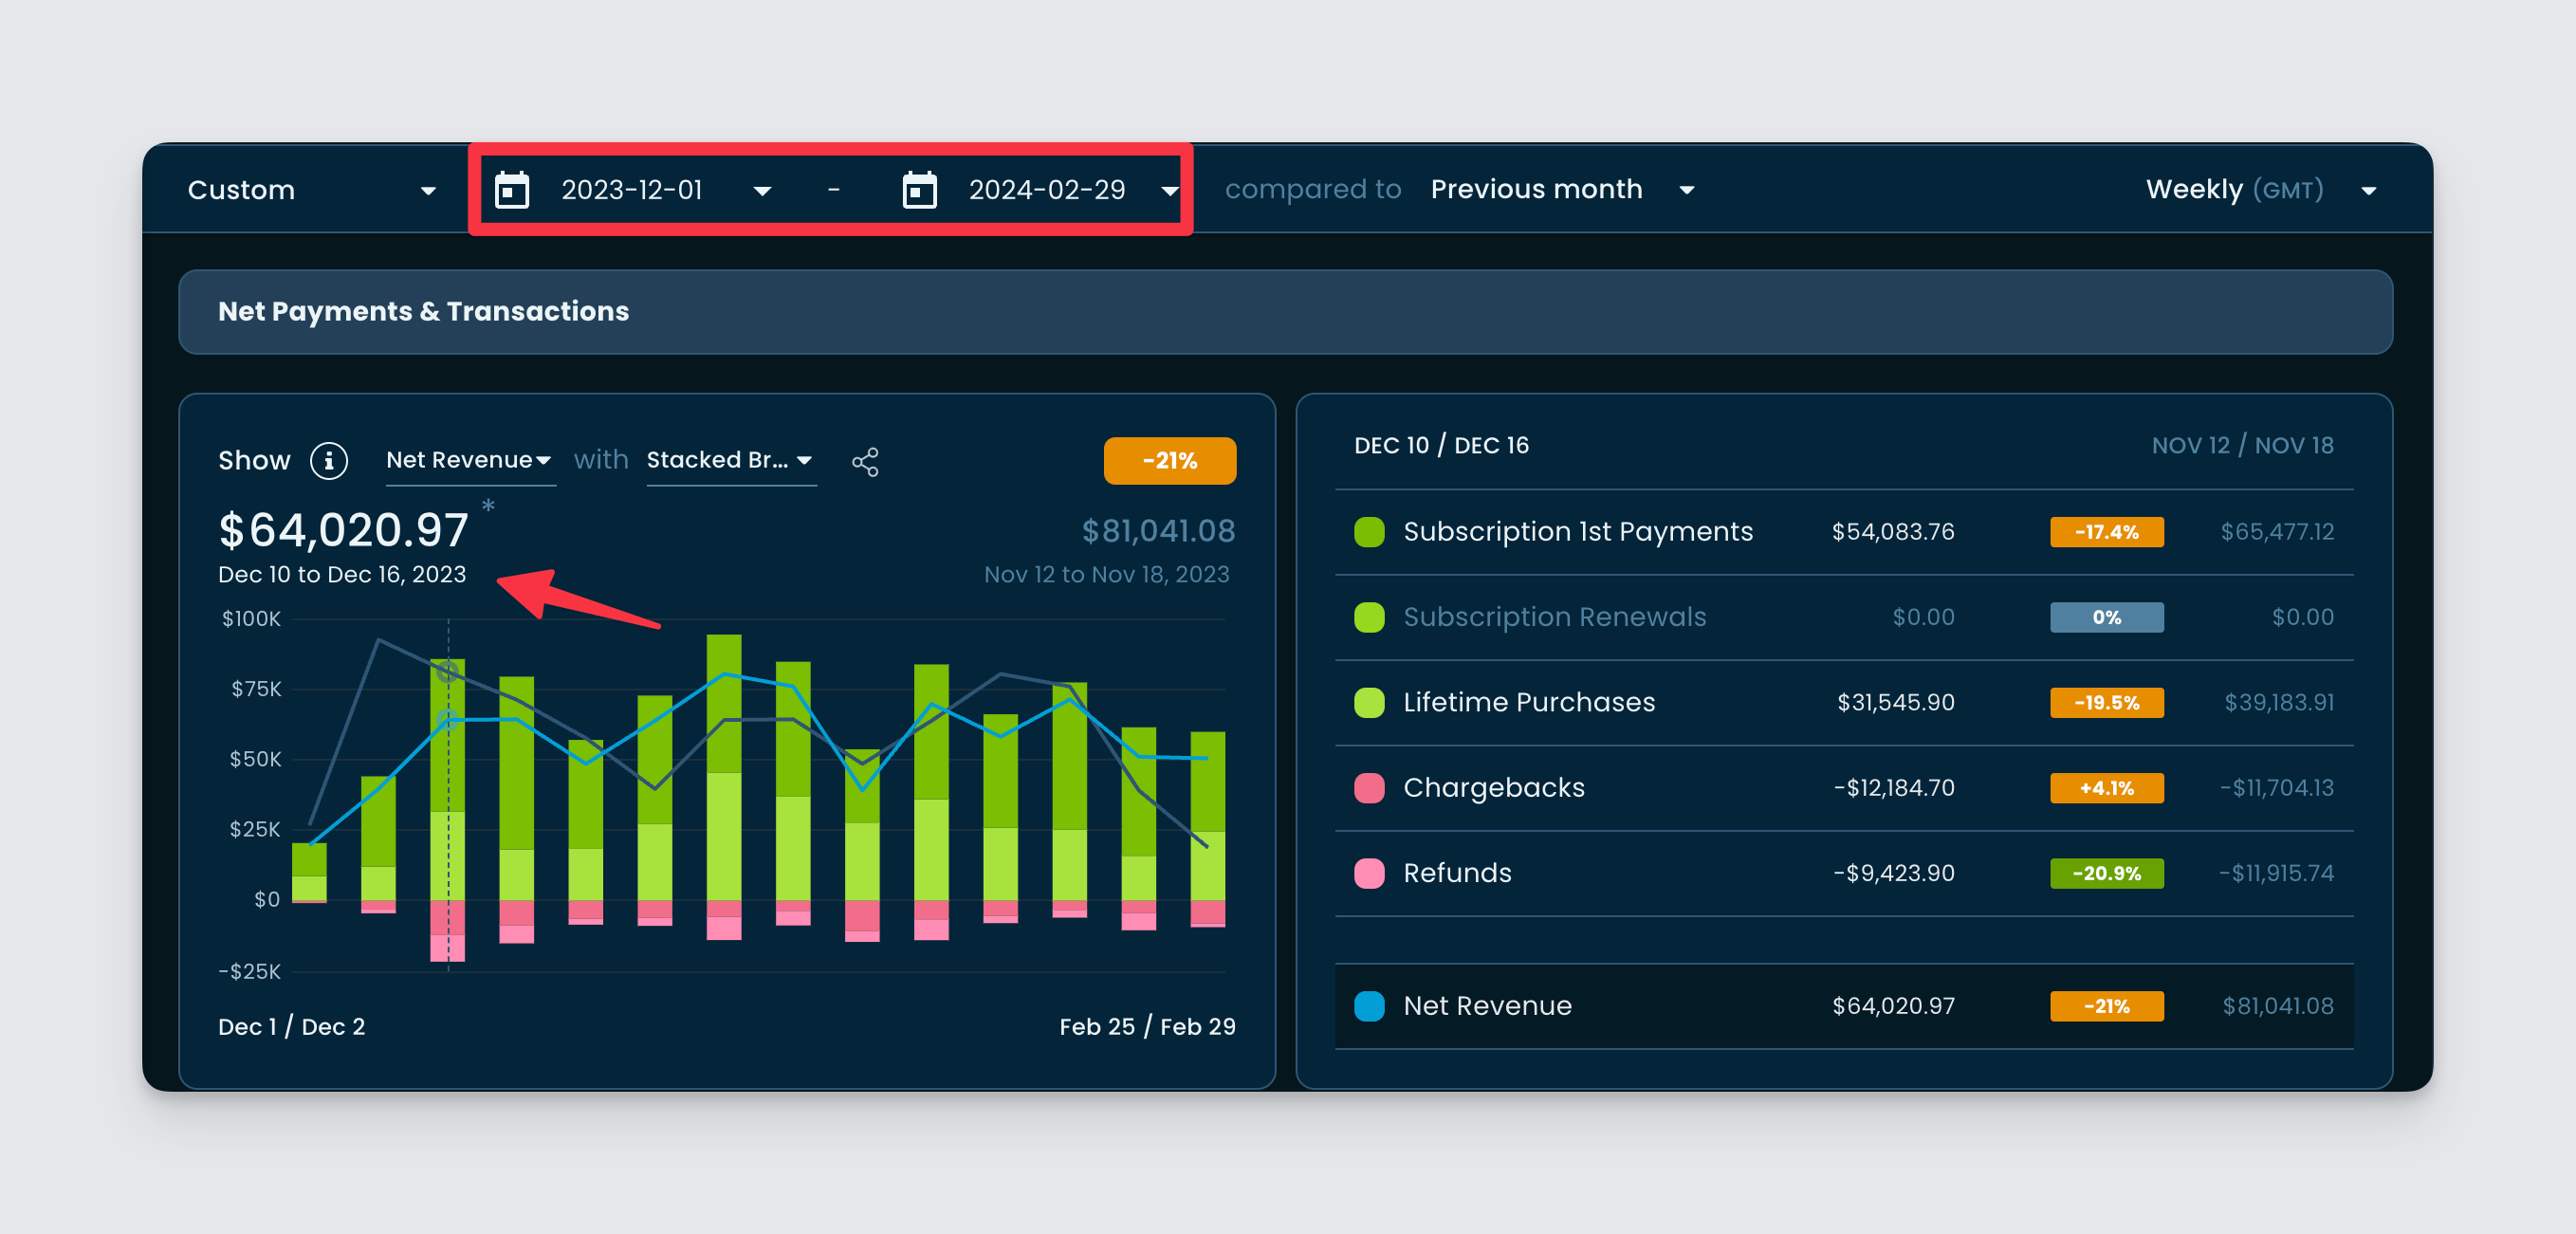
While hovering on a point, if the selected date range spans over different years, the UI will show the full year of the given node. This helps quickly understand which year the point falls on.