Major updates to the Multi-store Developer Dashboard
As another push to bring the Multi-store Developer Dashboard out of beta, we are glad to announce the following big features:
Multi-currency sales analytics
For those of you who are selling with multiple currencies, you’ll be glad to know that we’ve included a new feature in the Sales Analytics page to show all your transactions with a Foreign Exchange rate. Previously you could select only one currency at a time.
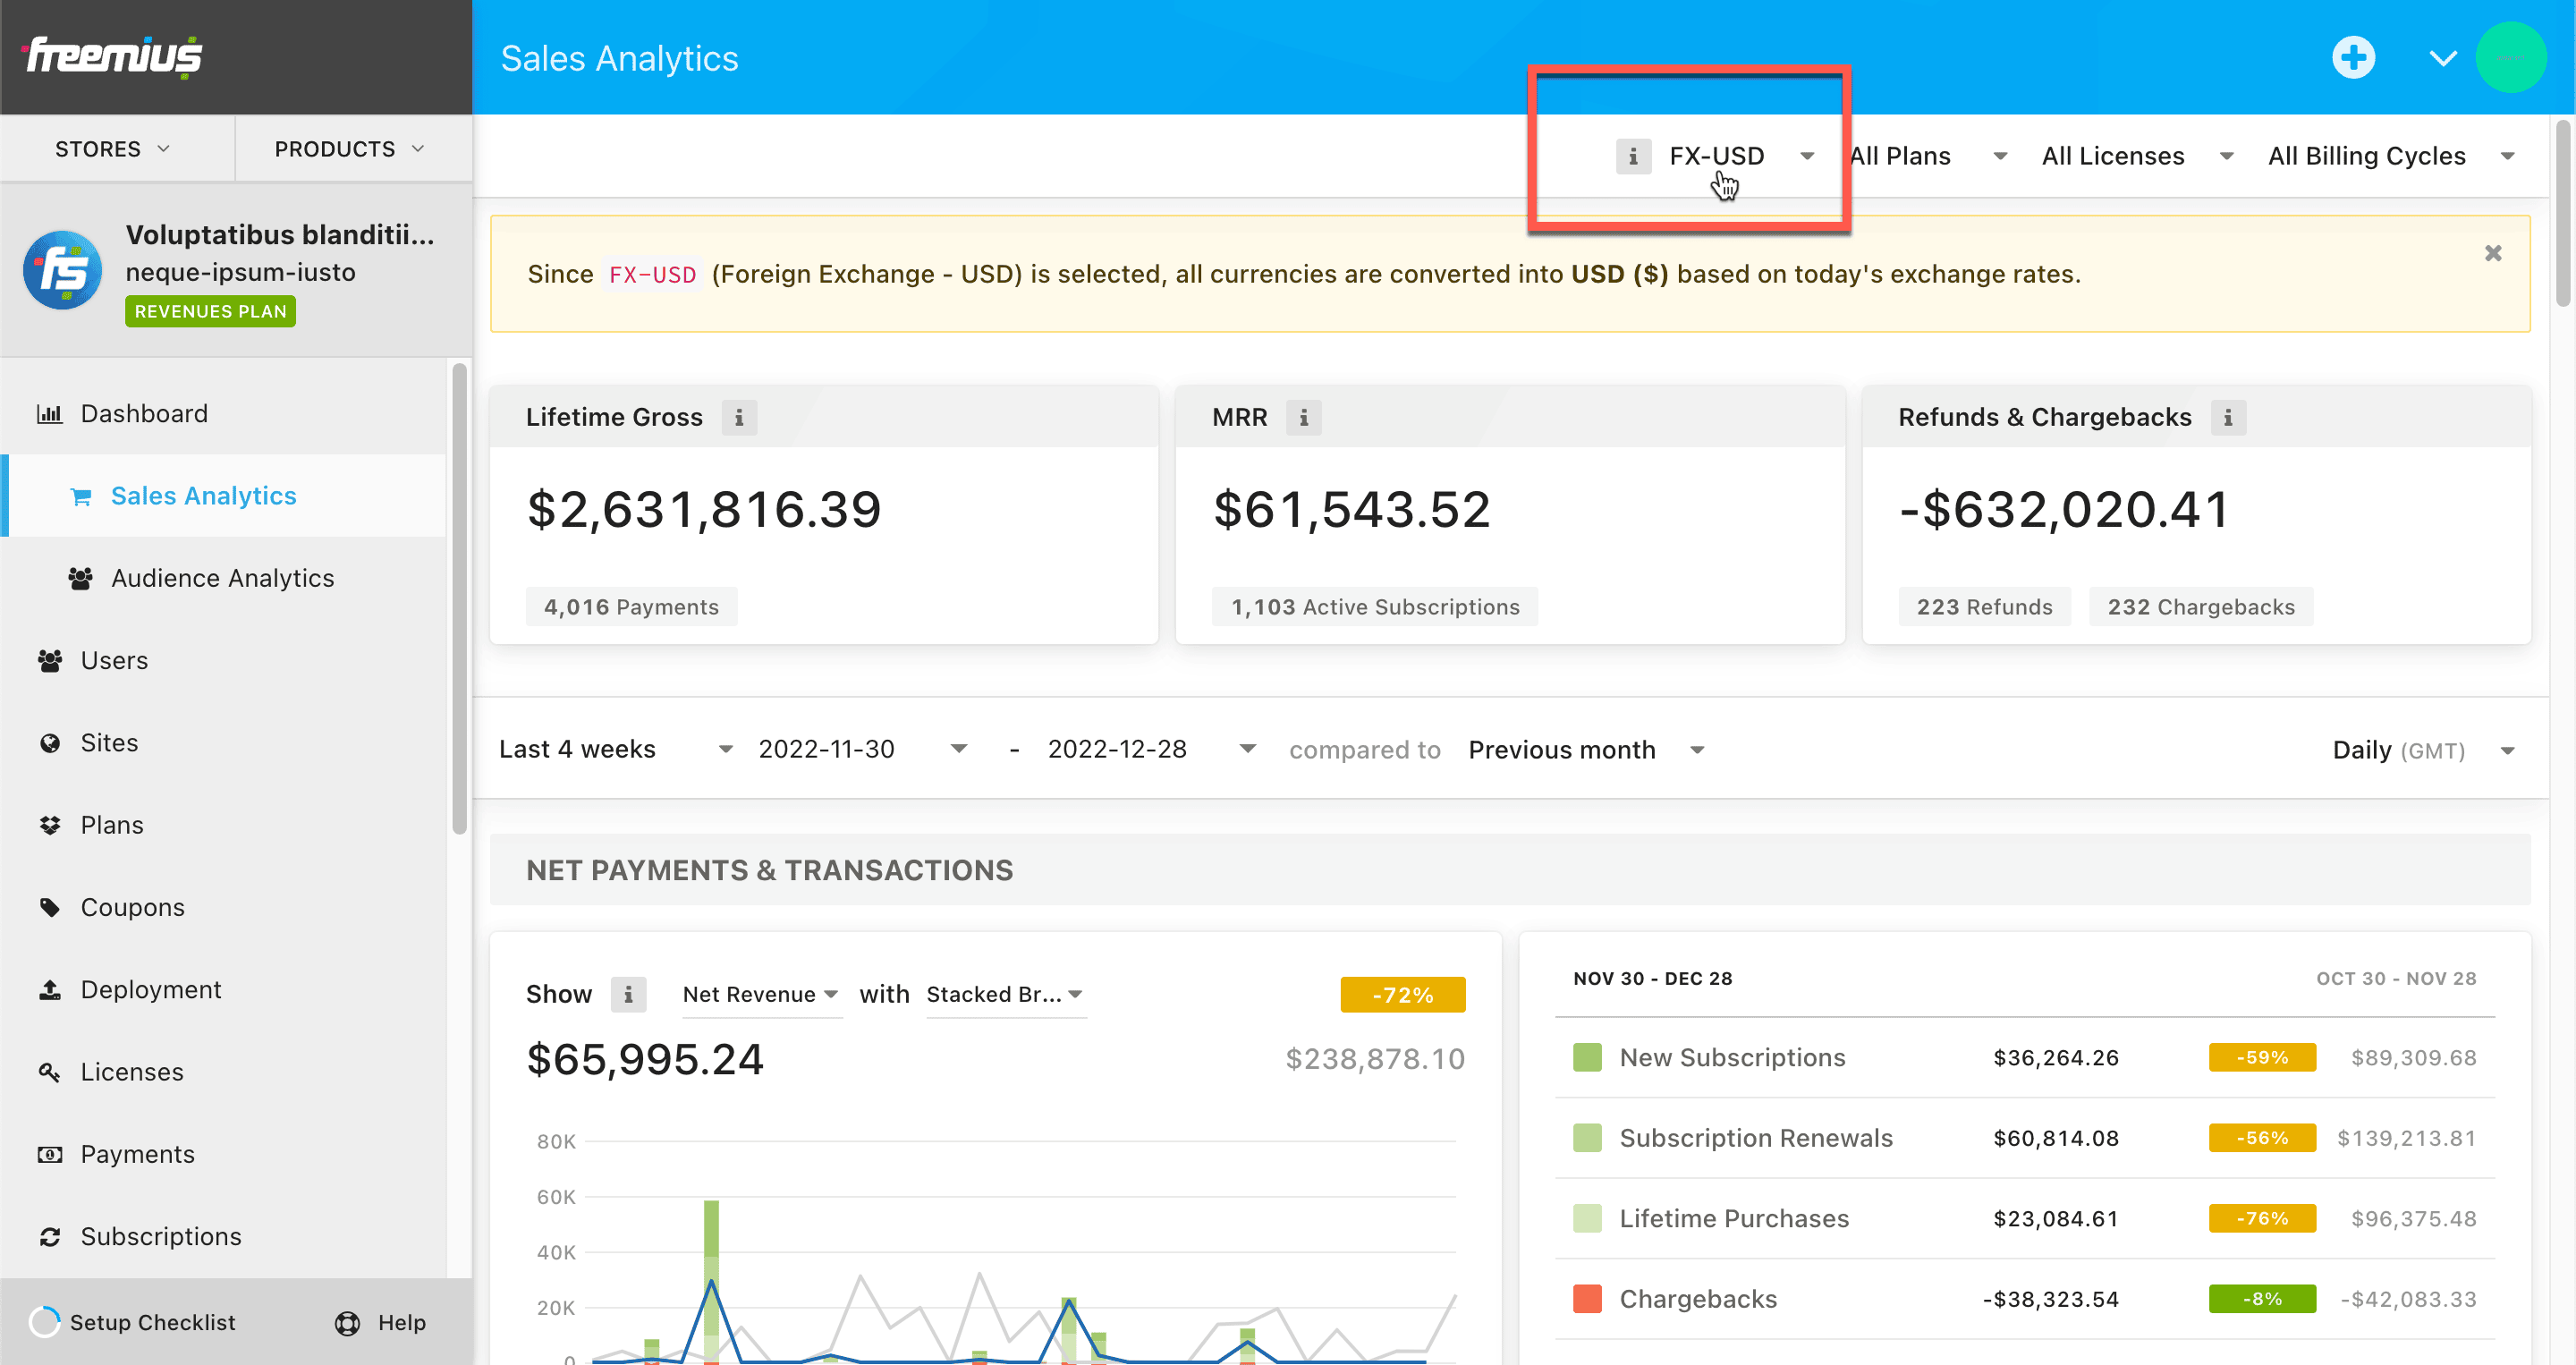
After getting some feedback from our partners, we have included a special “FX USD” currency which will take all your transactional data and convert the non-USD currencies with the current day’s exchange rates.
Refreshed Sidebar
This has also been on our to-do list for a long time. Before taking the Multi-store Developer Dashboard out of beta, we wanted to make sure we are giving a simple and intuitive experience when switching between stores and products.
Following several rounds of feedback and many brainstorming sessions within the team, we’ve come up with a sleek tabular interface to list and switch between all your stores and products.
You can click on any of the tab buttons and it will show you the corresponding list. You may click on it again and it will toggle you back to the current view.
Improved date picker in the Analytics pages
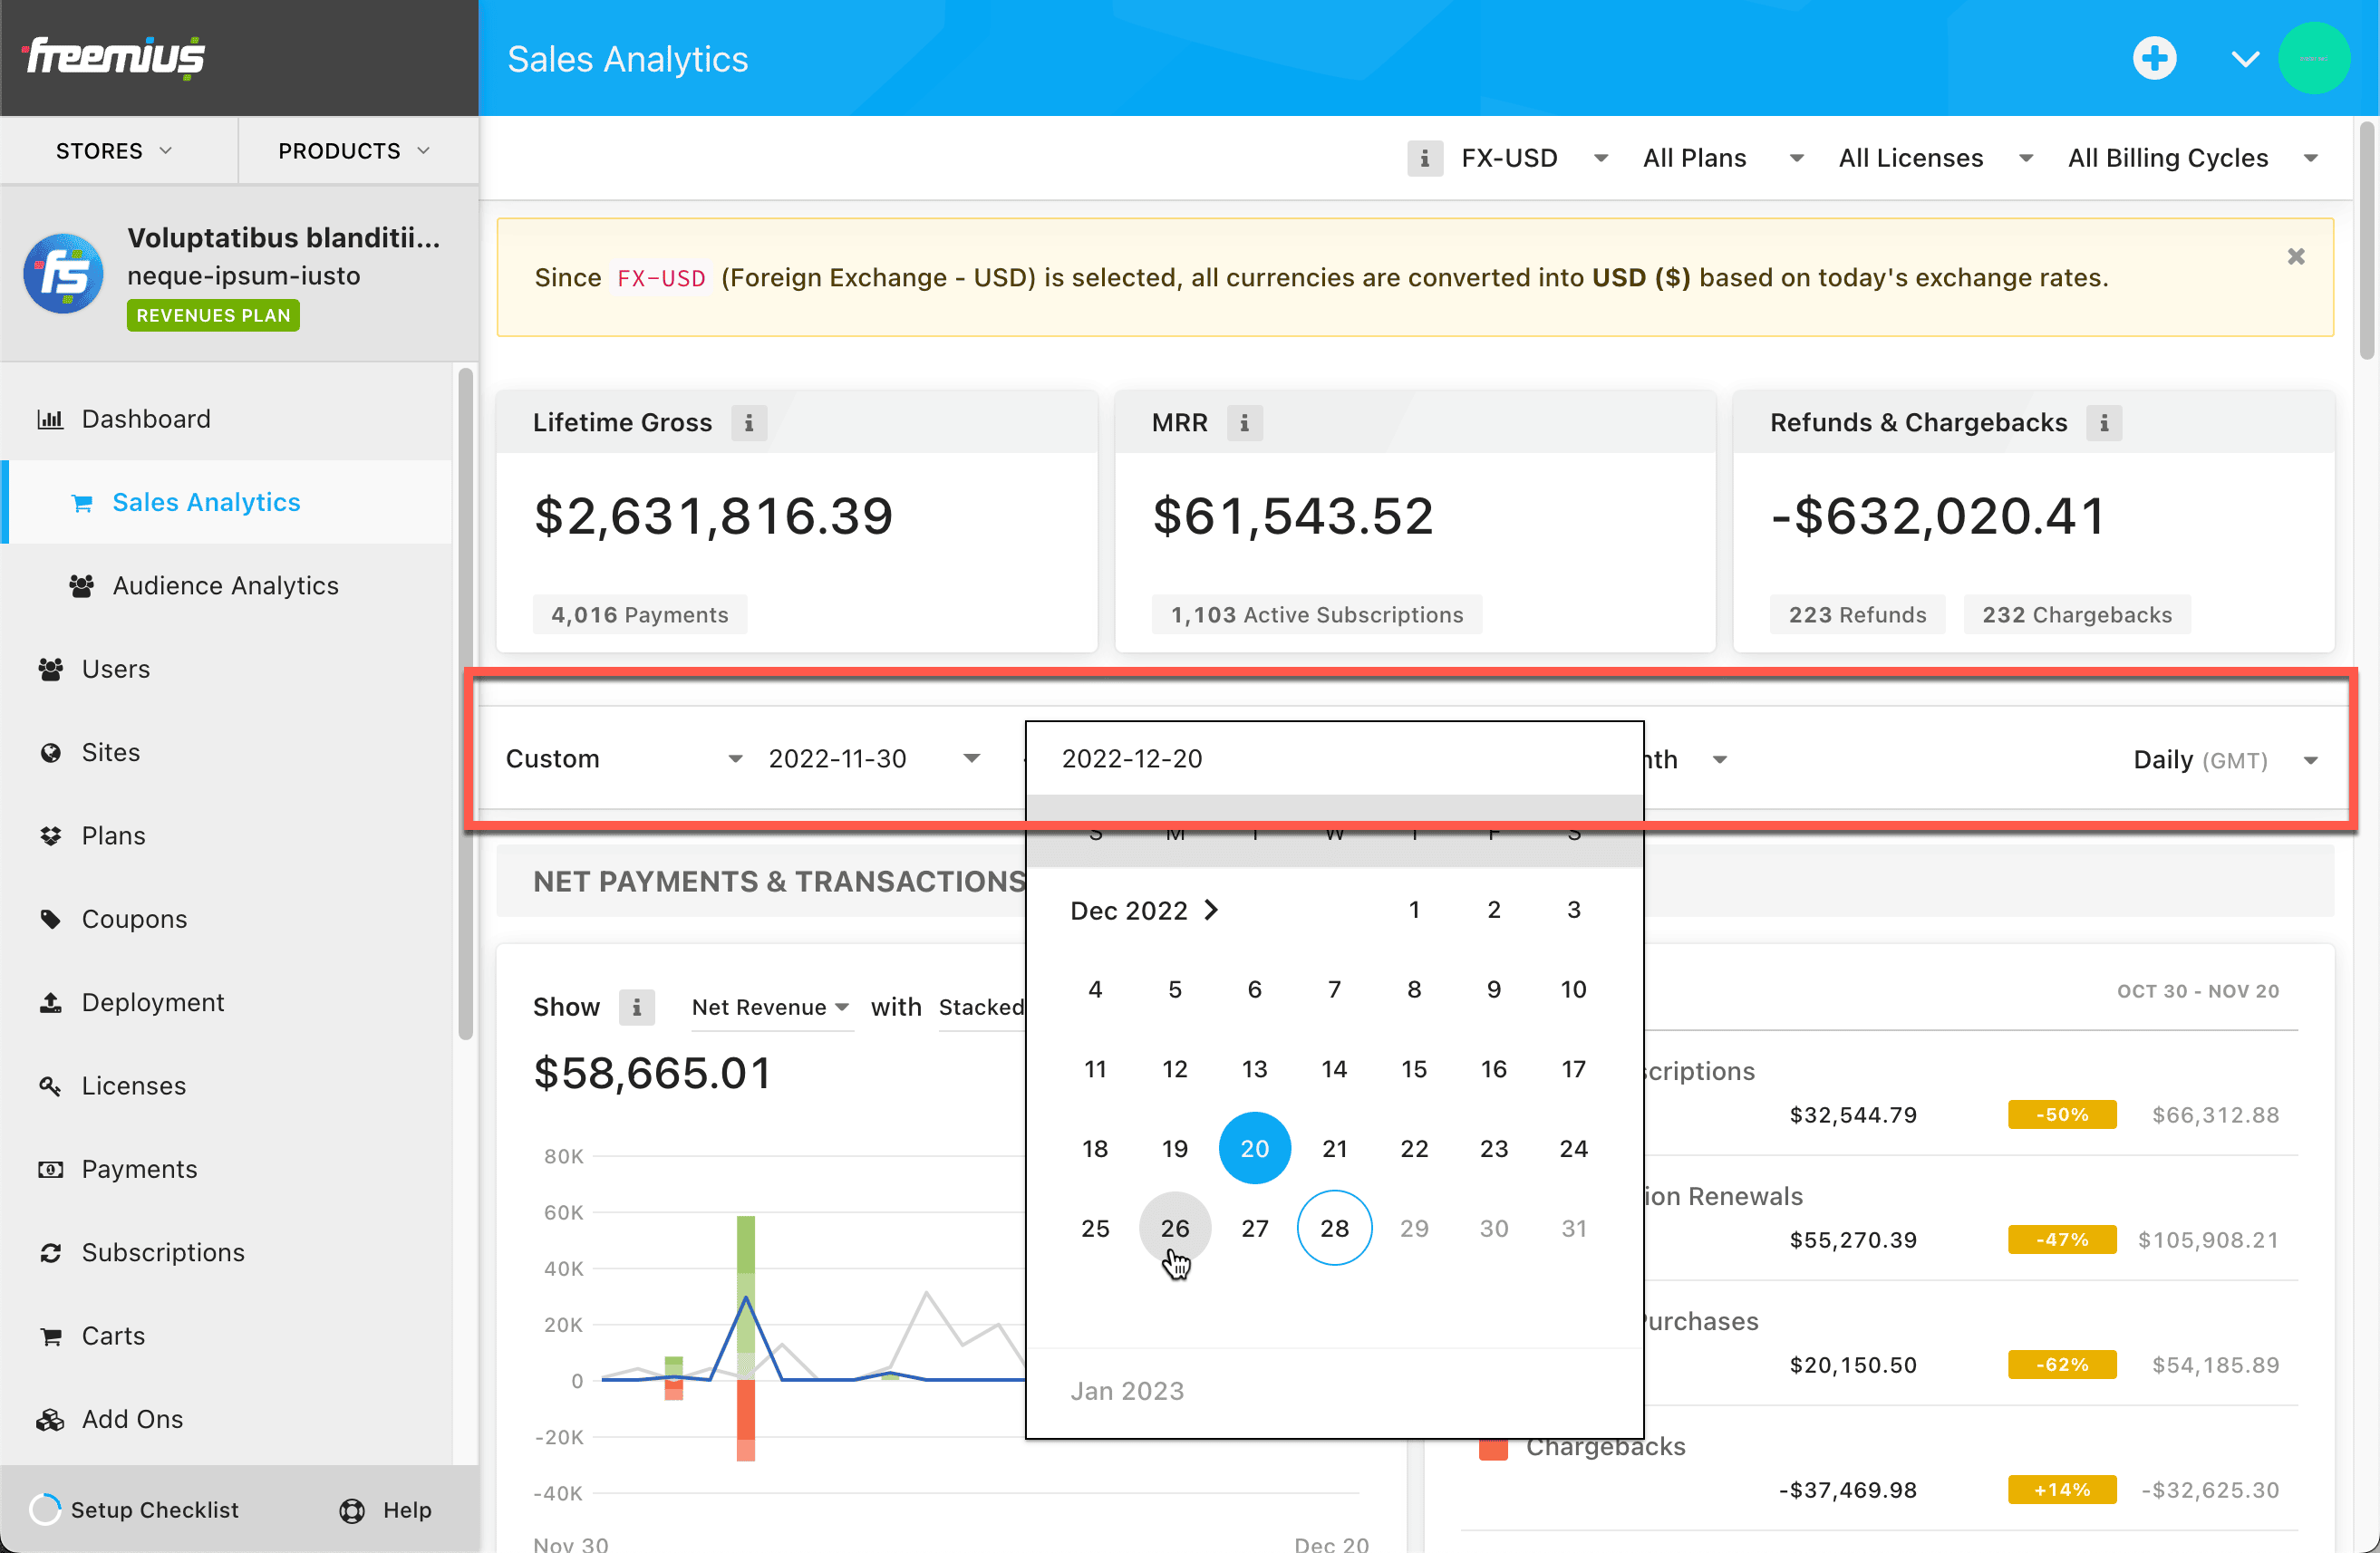
To make the date pickers in the analytics page more intuitive, we have made the following changes.
- When you pick a date on the sales and audience analytics pages, the UI – if needed – will automatically change the resolution (from daily, weekly, monthly, etc.) to best accommodate the dates you have selected.
- When you are changing the resolution, the dates you’ve selected may get changed to accommodate the resolution.
In the future, we want any resolution to support any date ranges. Right now. there are some limitations, for example:
- The “Weekly” resolution will only return data from a Sunday to Saturday, no matter what date you’ve selected.
- Similarly, the “Monthly” resolution will only return data from the first of the selected month.
- For this reason, on the main Dashboard page, we have temporarily disabled selecting custom dates.
We are working on a mechanism to fix this ASAP. Please stay tuned.
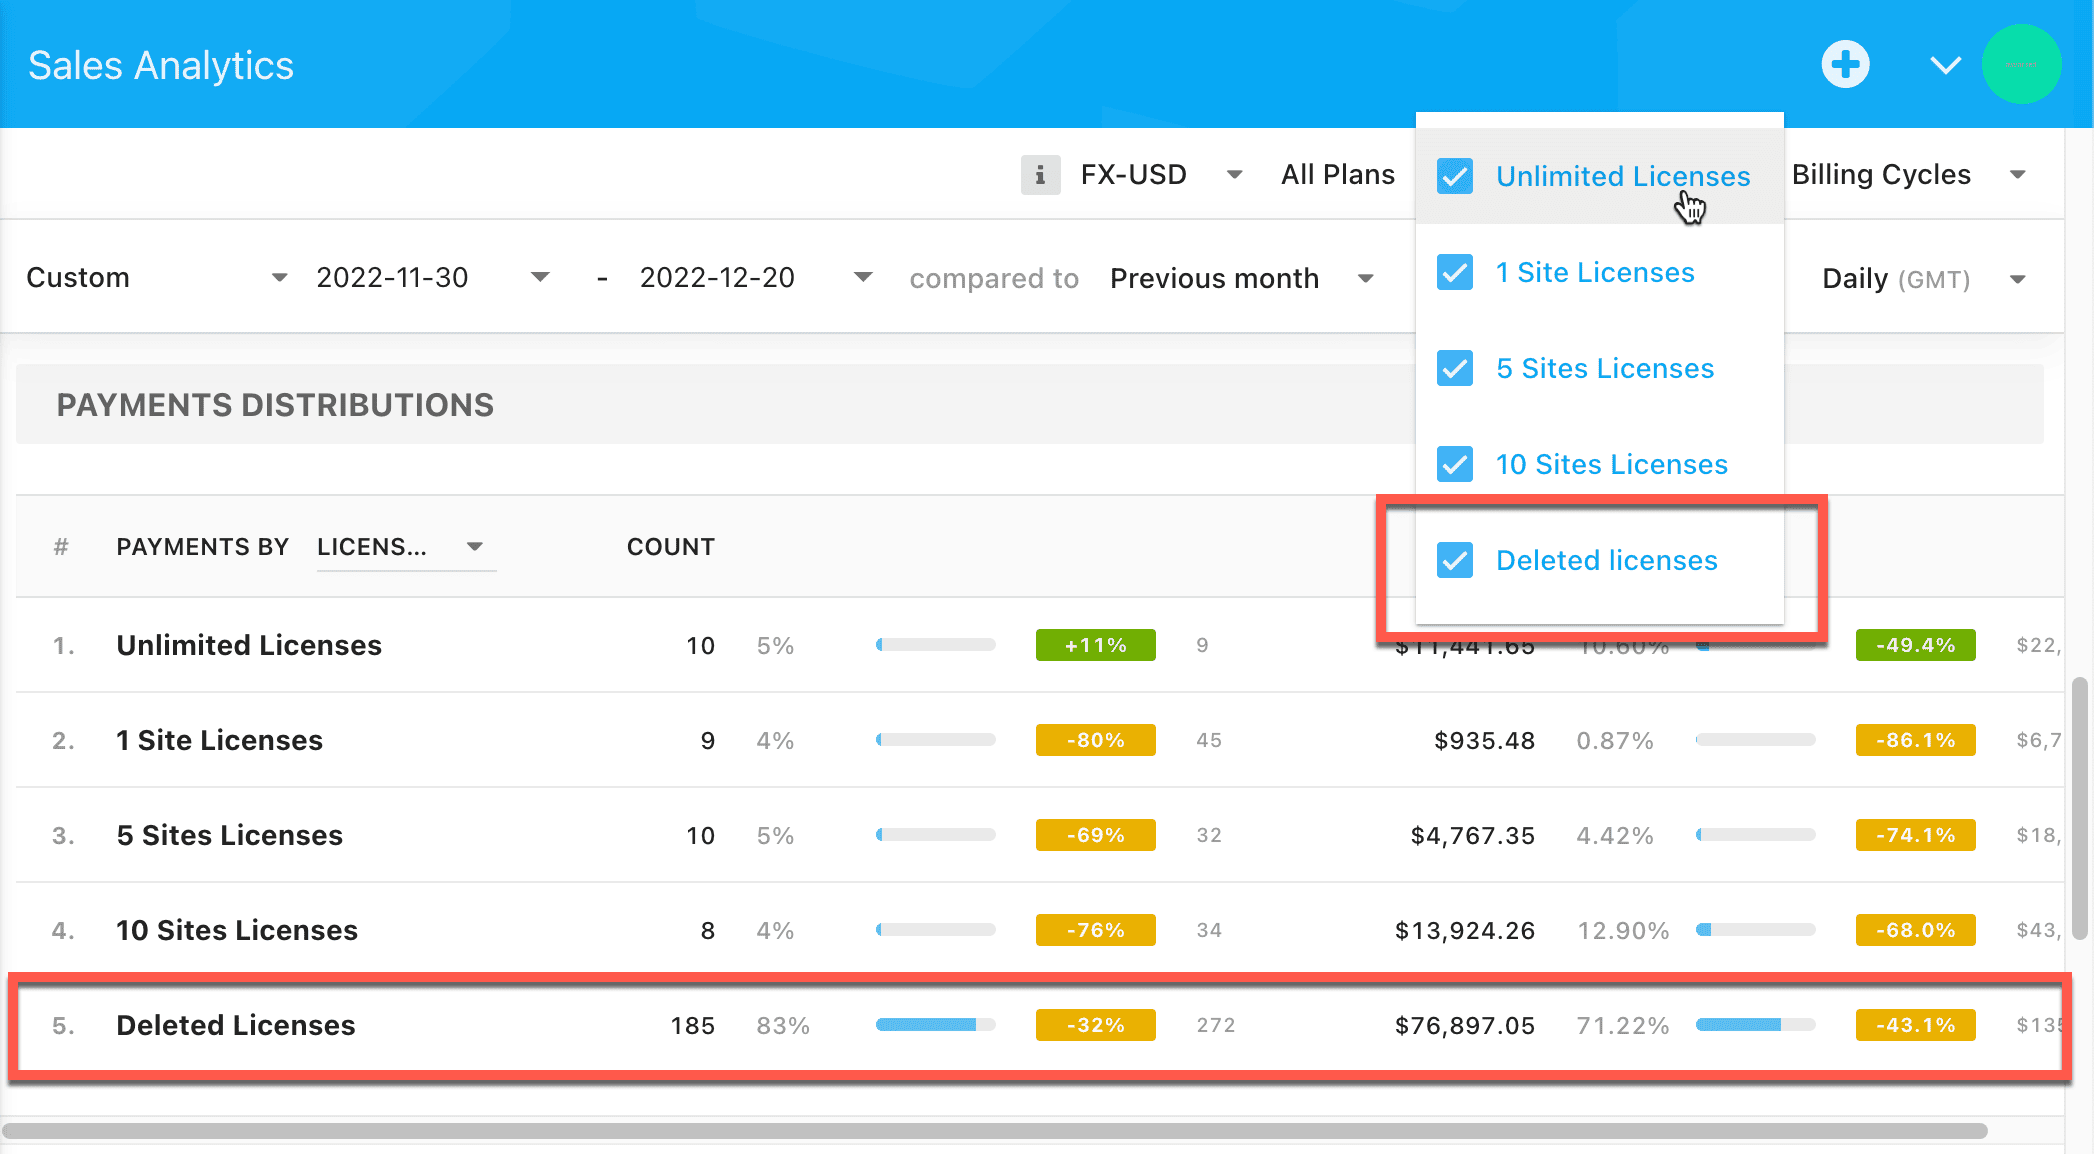
Showing deleted entities in Sales Analytics filtering
We noticed that the new Sales Analytics filter was neglecting any deleted plans, billing cycles, licenses, etc. For the time being, we are handling this by adding a new filter option called “Deleted Licenses” in all filters (checked by default, if any).
We are working on a robust solution to be able to see and filter through the deleted plans/licenses/billing cycles, etc.
Miscellaneous fixes
- Fixed a regression when plans of a product are not loaded properly when switching between products of different stores.
- Fixed regression when the “Integration Code” pop-up would appear incorrectly when navigating to the plans page.
- Fixed regression when deleting pricing didn’t work.
- Fixed regression when the “Sales Analytics” incorrectly started to show up for non-monetizing products.