New Average Order Value chart & improvements to the analytics
We’ve added tons of shiny new updates to the Freemius analytics. Starting today, you’ll see a new “Average Order Value” chart on the Sales Analytics page. We’ve also improved the categories of the “Total Installations” chart.
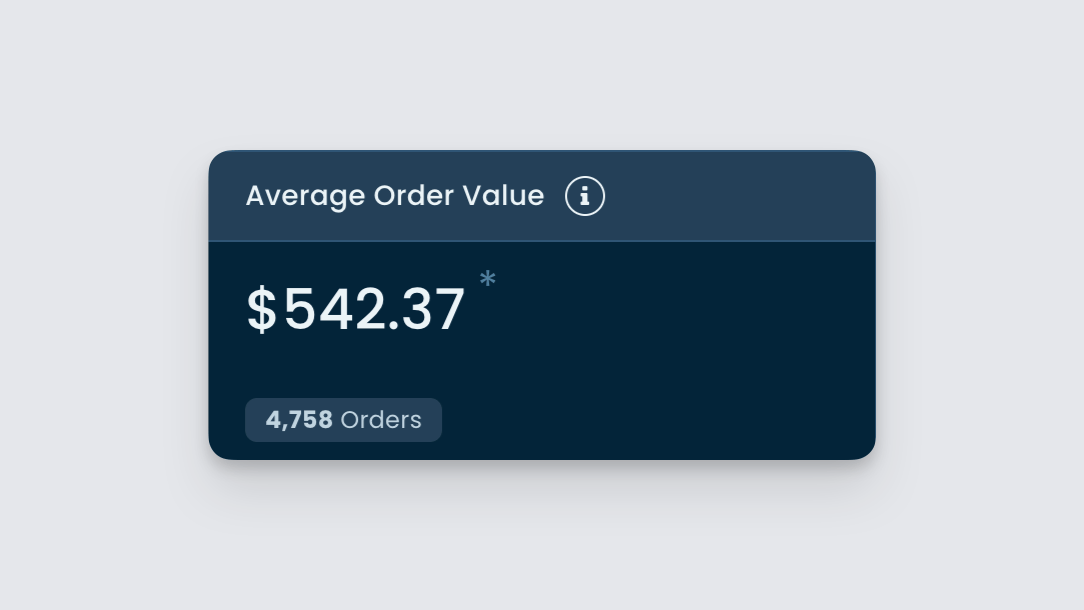
Average Order Value
Average Order Value (AOV) is the average revenue per order, including subscription renewals, lifetime purchases, and paid trials. On the Sales Analytics page, a new card displays the AOV since you first published your product with Freemius.
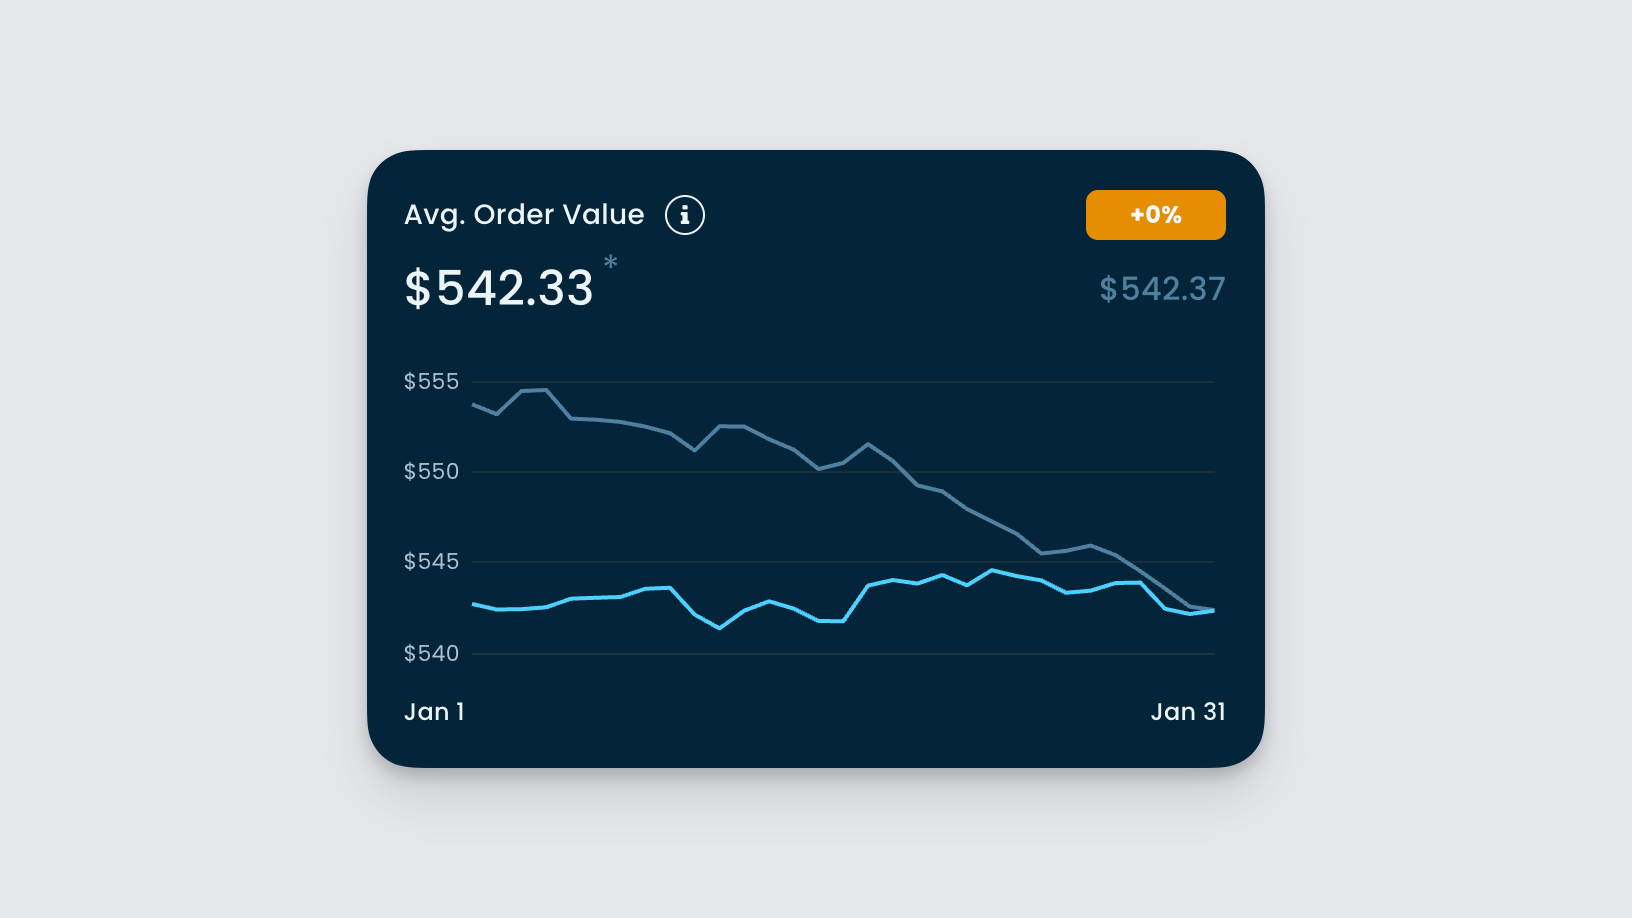
Further down the page and under the Revenue section, a chart showing AOV changes for a selected period is displayed.
Total Installations
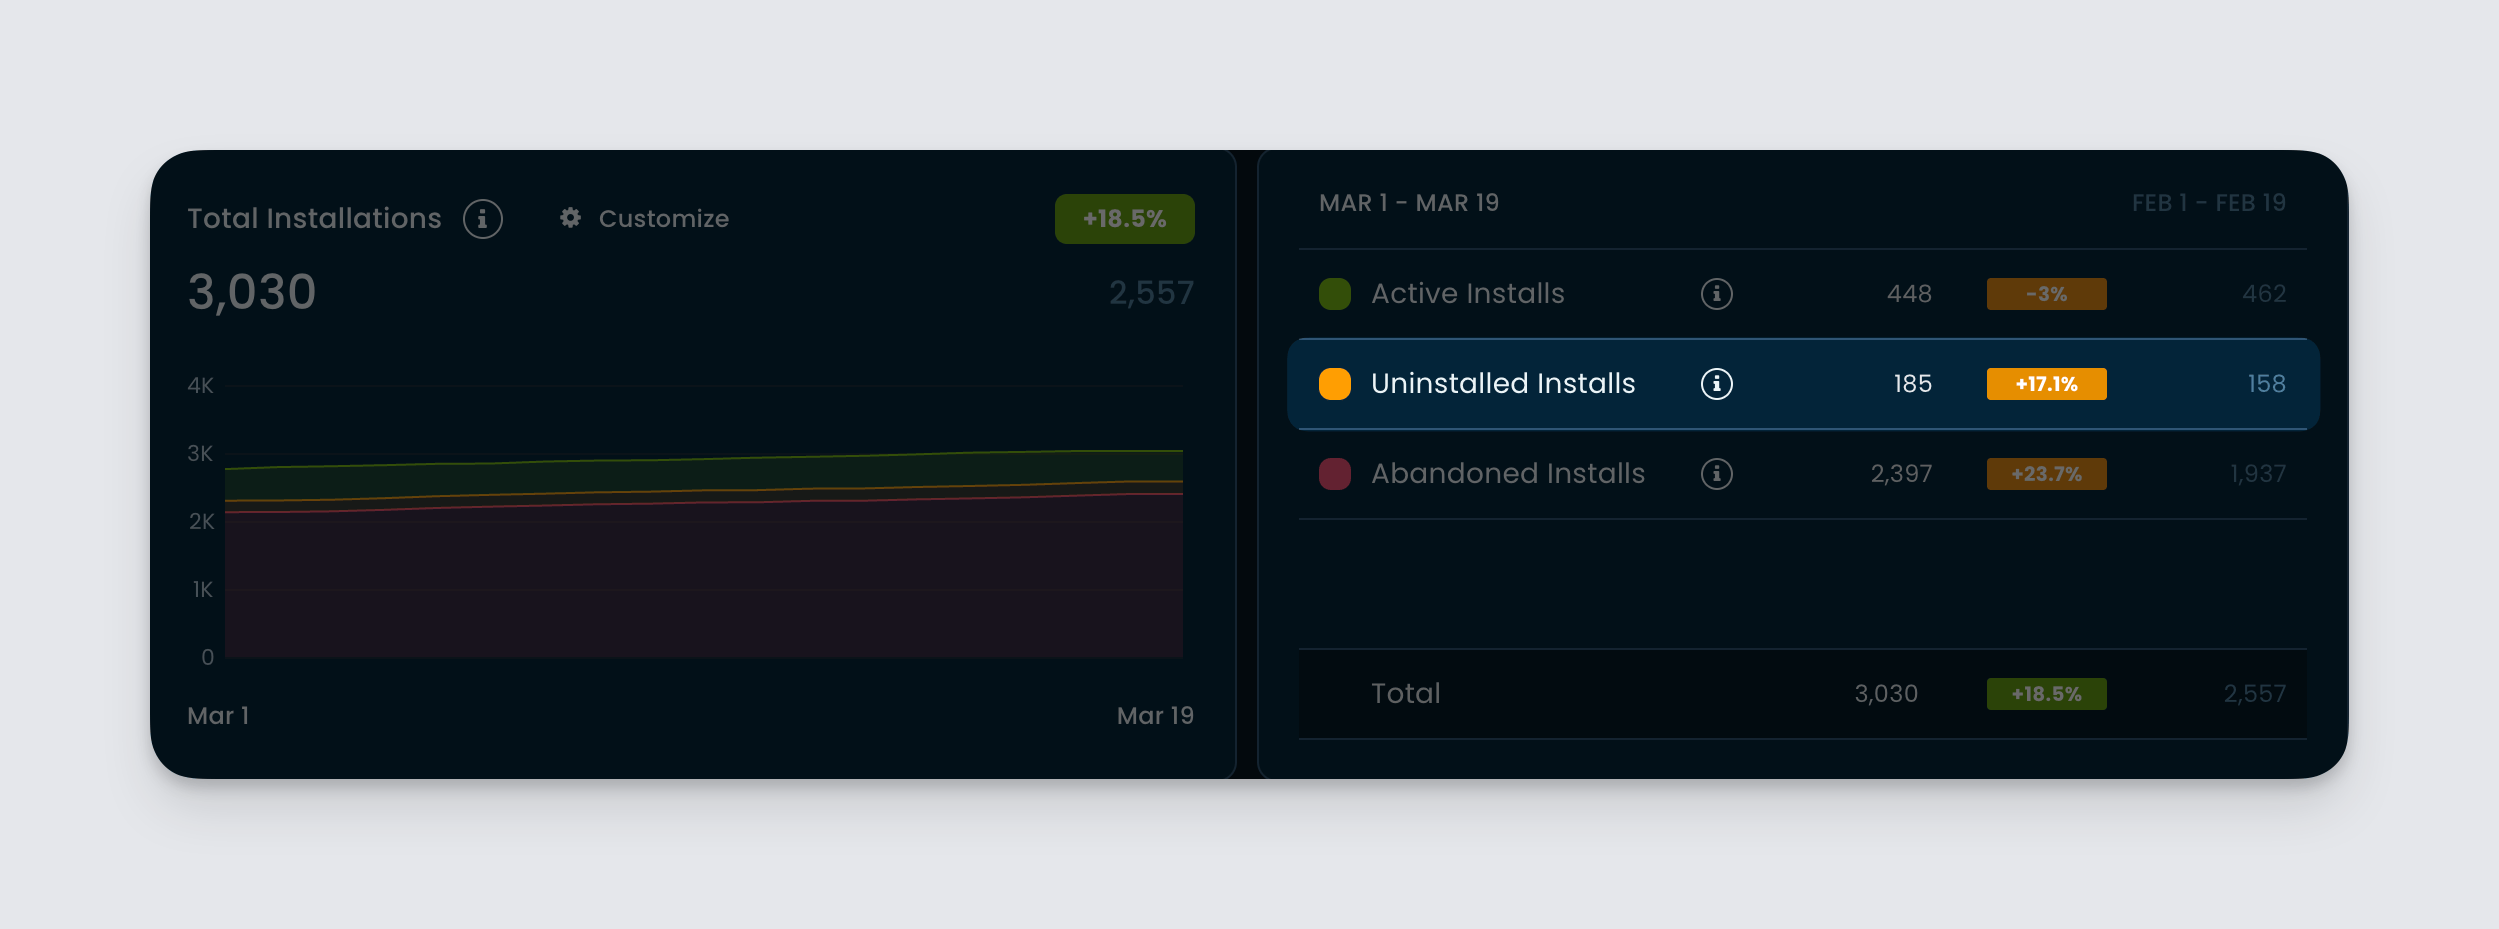
We’ve added a new category called “Uninstalled Installs” to make the Total Installations chart more useful. This new category displays the number of installs explicitly uninstalled or removed.
Made the Currency Selector persistent
This was a feature request from our partners.
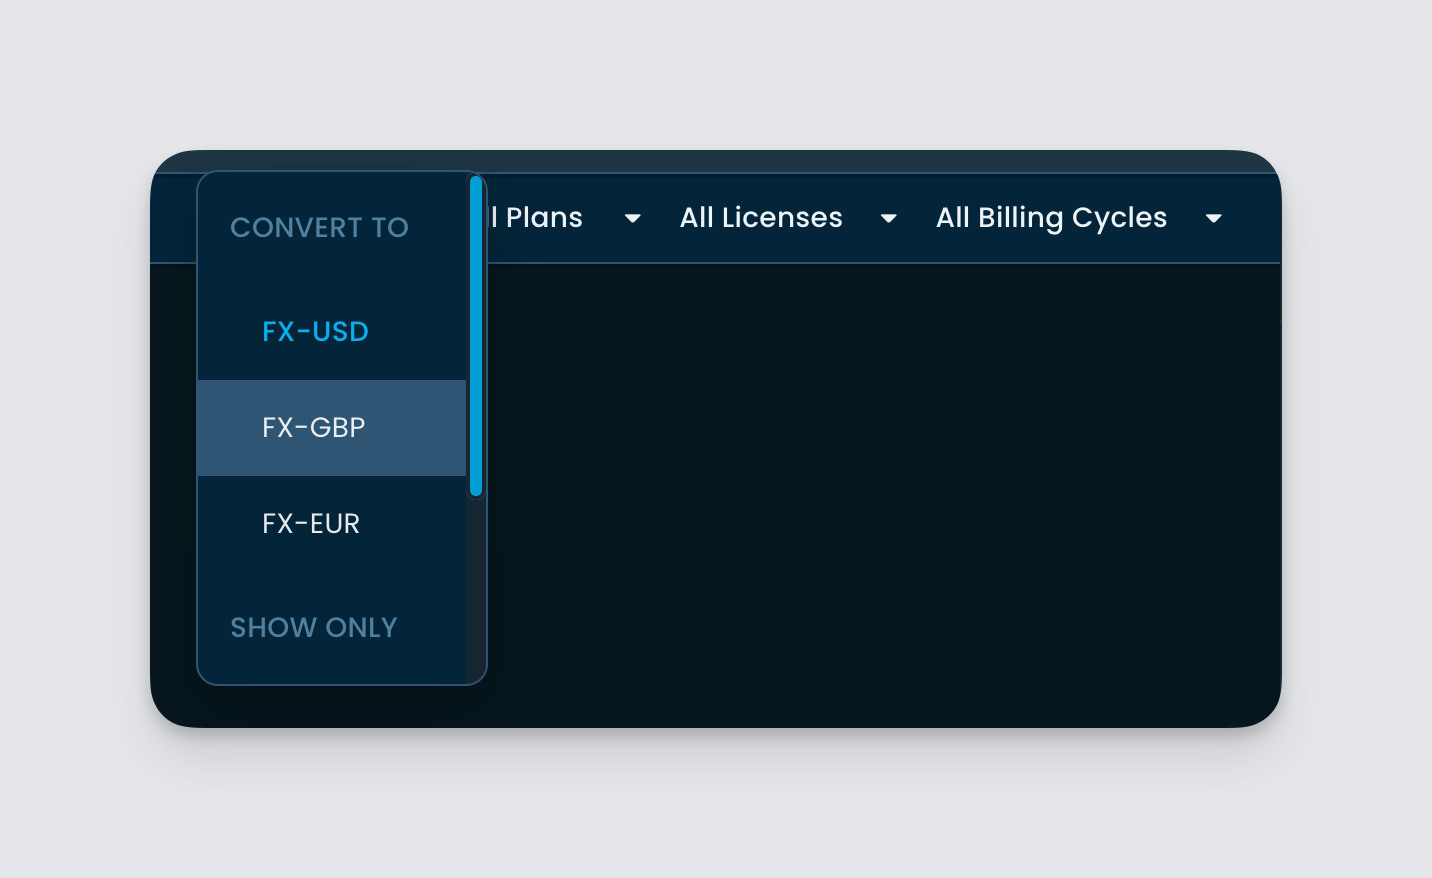
From now on, when you select a currency for a product or a store, the selection will persist in your browser.
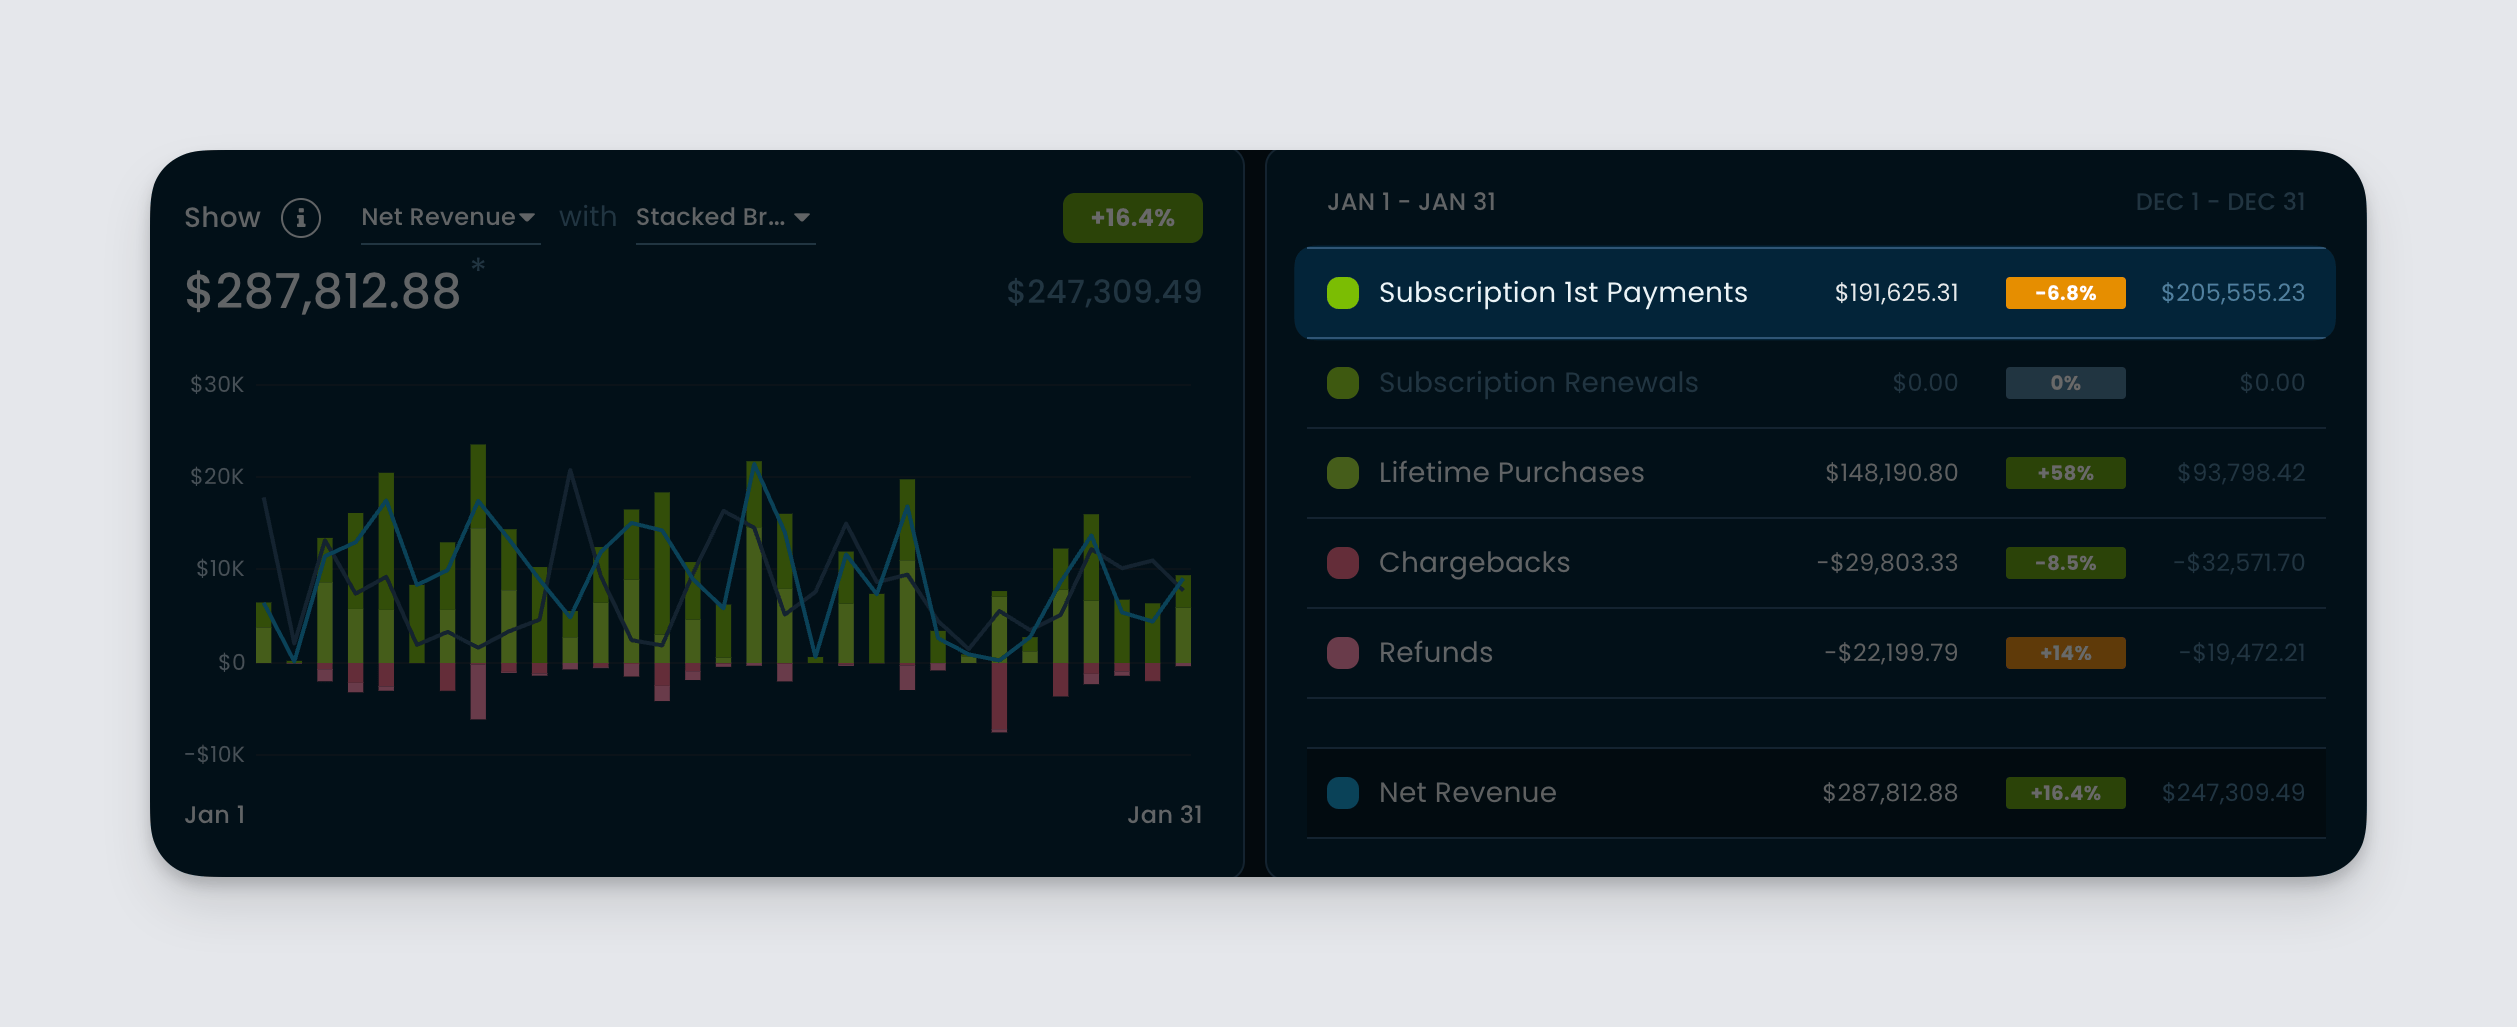
Improved the legend of the Net Payments & Transactions chart
The first legend of the Net Payments & Transactions chart used to be labeled as “New Subscriptions”. This created some confusion as the metric was showing the first payment of a subscription. If you’re offering a paid trial, the first payment of a subscription can come weeks later.
To clear up the confusion, we’ve renamed the legend to Subscription 1st Payments. Thanks to our partners for reporting this!