Sales Analytics
Once you add Freemius to your product, data from every purchase is captured and displayed on your Freemius dashboard.
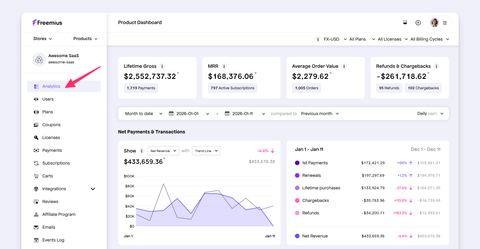
To see the sales analytics for your product, navigate to your Freemius Developer Dashboard, select the product you want to view the analytics for, and then click on the Analytics tab from the left sidebar.
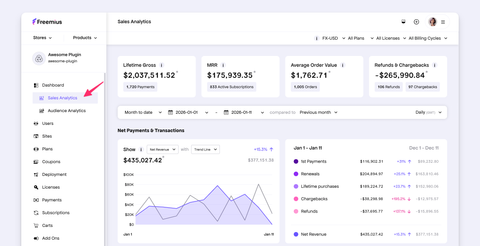
Depending on the type of the product you may also see a dedicated Sales Analytics tab.
Filtering the Data
At the top of your sales analytics dashboard, you can filter the data that has been gathered so far to display it by customized specific dates.
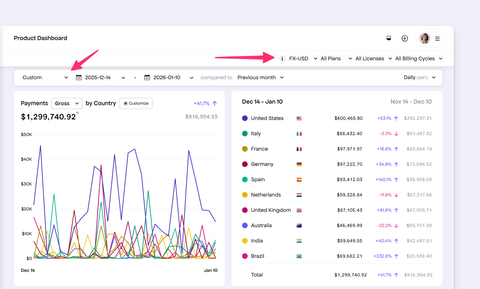
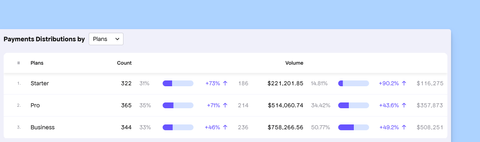
In addition, you can also filter the data by specific plans, billing cycles, number of licenses, currency, etc.
We support selecting an FX or Foreign Exchange currency to view your sales data in. This is especially useful for developers who sell in multiple currencies and want to see their sales data consolidated in one currency.
Visualized Sales Data
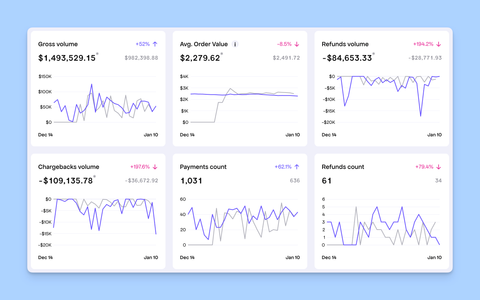
Throughout the page, you'll see a visualization of your important data that's related to your product's sales performance and conversion rate:
- Net Revenue: The total revenue generated from your product sales including 1st payments, renewals and lifetime or one-off purchases, after deducting refunds and chargebacks.
- Revenue: Various charts including Gross volume, Average Order Value, Refunds, Chargebacks, Payments etc.
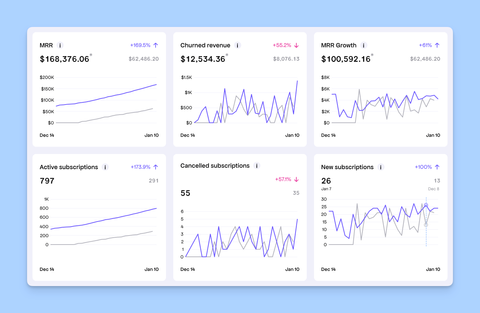
- Subscriptions: Various charts including MRR (Monthly Recurring Revenue), Churned revenue, growth, new subscriptions, cancellations etc.
- Trials: Various charts including trial to paid conversion rate, new trials, trial cancellations etc.
In addition, there's also a small table with a summary of your billing cycles and payments to help you keep track at a glance, without always having to dig deep.
We also show a Payments distribution by Country chart, to help you understand where your customers are coming from.
