
|
|
Many software makers fail to capitalize on profit opportunities because they don’t look at their data — at least not the right way.
According to PR Newswire’s research, 80% of businesses see a boost in revenue when relying on real-time analytics, as it allows them to act fast and focus on things that truly move the needle.
So, instead of perfecting features and chasing new customers, focusing on your existing user data could reveal untapped revenue patterns, especially if you use cohort analysis.
What if you could pinpoint exactly when customers churn, which features drive upgrades, who your best buyers are, and how to optimize pricing based on actual usage? That’s how leading software businesses double their customer lifetime value without doubling their workload.
In this guide, we’ll show you how to implement cohort analysis for WordPress and SaaS products to stop passing up earning potential — led by valuable insights from Ashley Faus, Head of Lifecycle Marketing at Atlassian, and Patrick Posner, founder of successful WordPress business Simply Static, and other experts.

What is Cohort Analysis and Why Software Makers Need It
Cohort analysis evaluates your customer data by grouping users based on shared characteristics — cohorts — and tracking their behavior over time.
Instead of looking at all your customers as one big group, cohort analysis breaks them down into smaller, meaningful segments. This reveals specific patterns that would otherwise be hidden in your overall averages.
For example, seeing how customers from a pricing promotion perform over a year versus those who paid regular prices.
There are several examples of cohort types that may be relevant for software makers:
| Acquisition cohorts | Grouping users by when they first purchased your product, for example: Q1 2024 sign-ups vs. Q2 2024 sign-ups |
| Industry cohorts | Segmenting customers based on their business sector or industry, for example: comparing SaaS companies vs. e-commerce businesses |
| Plan/package cohorts | Analyzing behavior based on which plan users selected, for example: comparing renewal rates between users on your “Pro” vs. “Standard” plans |
| Subscription cohorts | Grouping users by billing cycle or commitment level, for example: comparing monthly vs. annual subscribers to understand differences in lifetime value, price sensitivity, and long-term retention patterns |
| Feature usage cohorts | Segmenting based on which features users engage with, for example: comparing users who utilize your advanced reporting tools vs. those who don’t |
| Referral source cohorts | Grouping customers by how they found your product |
A perfect example of how data analysis can reveal your true ideal customers hiding in plain sight:
Patrick thought agencies would be his best customers for Simply Static, a WordPress plugin that creates lightning-fast static pages. Despite making tons of tutorials and marketing content for agencies, his results were merely satisfactory.
The turning point came when he analyzed his customer data and grouped it by industry. Patrick surfaced that 60% of his users were specifically security companies.
“These companies usually buy bulk plans instantly — 50 sites at once — and only reach out with questions every few months,” Patrick explains.
This discovery completely transformed his strategy, which we explore in the video below:
Why Software Makers Have an Advantage with Cohort Analysis
The digital nature of software products creates a perfect environment for cohort analysis, giving makers an edge in spotting revenue opportunities that might remain invisible in other industries:
- Digital tracking: You can capture granular usage data automatically through your analytics dashboard, without requiring manual surveys or customer interviews and manually analyzing the data.
- Subscription models: Recurring revenue makes patterns more visible and actionable, because, unlike one-time purchases, subscriptions generate consistent behavior markers at regular intervals (trial, conversion, renewal, upgrade) and make it easier to identify which customer segments are thriving and which are at risk.
- Feature flagging: You can test how features affect retention by turning them on for specific user groups and measuring the results — without affecting all your users.
- Iterative development: Quickly respond to cohort insights with new features. Once you discover a pattern, you can quickly implement targeted changes to your pricing, features, or marketing to better serve your most valuable cohorts.
Patrick’s experience with Simply Static illustrates this well: As mentioned, analyzing his customer data revealed that security companies were both his highest-value and lowest-support customers.
Without cohort analysis, these patterns remain hidden, and you’re left making decisions based on incomplete information. And now that you understand the benefits of using cohort analysis, we’ll explore how to actually execute it.
How to Implement Cohort Analysis Step by Step
The phrase may sound intimidating, but cohort analysis is simpler than it seems. Here’s how to get started with actionable steps specifically designed for software businesses.
Step 1: Identify and Define Your Cohorts
Begin by selecting meaningful ways to group your customers, based on your most pressing business questions and current growth challenges. Identify your key metrics that need improvement (churn rate, conversion rate, LTV) and define cohorts that directly address that issue.
We mentioned some of the common cohorts in the section above, but you could find any relevant shared characteristics among your users:
- Use case
- User profile
- Engagement level
- Renewal behavior
- Support interaction
- Geographic location
- Upgrade/downgrade
Depending on the cohort, you can discover which customer segments deliver the highest lifetime value, why certain groups churn, and more.
Here’s how Andrew Dunn, VP of Marketing at Zentro Internet, did it with his team:
“One way we’ve used cohort analysis was during the rollout of high-speed fiber to a big residential complex in downtown Chicago. We grouped users by the month they signed up so we could track how each group behaved over time,” shares Andrew.
“The first group to join had way better retention and engagement than the ones who came later. It turns out our early efforts — like welcome events and hands-on support — made a real difference. Since then, we’ve made those early-stage tactics a core part of every new launch. It’s been a great way to keep improving what we do, based on real data,” Andrew concludes.
Step 2: Select Essential Metrics to Track for Each Cohort
The second step is to choose key performance indicators (KPIs) for each cohort. Track them over a specific time period, based on your business goals and revenue drivers. Start with a few high-level metrics, then expand your analysis as patterns emerge and specific cohort behaviors require deeper investigation.
Here are a few examples of metrics to begin with:
| Retention rate | What percentage remains active at 30, 60, 90, 180, and 365 days? |
| Expansion revenue | How much additional revenue do they generate through upgrades or add-ons? |
| Feature adoption | Which features do they use most frequently, and how does this correlate with retention? |
| Time-to-value | How quickly do they achieve their first “success moment” with your product? |
| Support load | How many tickets do they submit relative to their revenue contribution? |
Step 3: Find Tools and Methods for Data Collection
For efficient cohort analysis, you need to define what methods and tools you’re going to use to collect the data.
You don’t need complex systems for cohort analysis — even spreadsheets can track basic cohort performance if you’re a solo maker or a small team. Start with what you have or can easily afford — like Google Analytics or Matomo, or if you’re a Freemius user, your Developer Dashboard.
Supplement your usage data with customer feedback to understand the “why” behind the numbers. This approach creates a more complete picture:
- Usage data tells you what’s happening: “80% of users who activate Feature X renew their subscription”
- Customer interviews tell you why: “Feature X saves me 5 hours per week, making the subscription worth every penny”
Here’s how you can collect data:
- Event tracking:
- Track specific actions: “First time user activated premium feature”
- Example: Monitor how quickly different cohorts reach these key milestone events
- Customer surveys:
- Use simple tools like Google Forms
- Example: Send targeted questions to cohorts with high retention vs. those who churned
- User session recordings:
- Tools like Clarity (Microsoft’s free tool)
- Example: Compare how January vs. March cohorts navigate your onboarding
- Email engagement:
- Use your email marketing platform’s reporting (Freemius integrates with MailChimp)
- Example: Track how different cohorts respond to feature announcement emails
Let’s illustrate with a few practical examples:
| Your product is a WordPress plugin… | Track users who installed your plugin in January vs. February. Compare how many from each group activated your premium features within 30 days to learn if seasonal timing affects premium feature adoption or if specific marketing campaigns attract users more likely to engage with advanced functionality. |
| Your product is a SaaS solution… | Create a simple dashboard that shows retention rates for different pricing tiers at the 30, 60, and 90-day marks. This will help you learn which pricing plans generate the most loyal customers and if there are critical drop-off points where specific interventions could improve retention. |
| Your product is a theme shop… | Track which acquisition sources produce cohorts with the highest renewal rates to learn where to focus your marketing budget and which channels bring customers who value your themes over the long term. |
Remember, the goal is actionable insights, not perfect data. Start simple, learn what metrics matter most for your business, and iterate your tracking approach over time.
Step 4: Follow an Analysis Framework
Once you’ve collected cohort data, you need a systematic approach to get meaningful insights that you can use for an actionable plan. Here’s how to analyze your cohorts effectively:
Compare Retention Curves
Plot retention rates for different cohorts over time to find which customer segments stick around longer.
Retention curves that vary dramatically between cohorts often signal product-market misalignment — and identifying high retention rates will help steer product development and marketing efforts in the right direction.
“If you find that every single deal you do you’re having to customize everything and make a bunch of exceptions, you probably are struggling with product market fit,” explains Ashley Faus in a plugin.fm podcast episode about lifecycle marketing.
Here are a few examples:
- Acquisition channel comparison: If customers you’ve acquired through content marketing show 15% higher retention after 90 days than those from paid ads, this suggests your content is attracting better-fit customers. In this case, you should consider shifting more of your acquisition budget toward content development.
- Pricing plan patterns: Compare retention curves across different pricing tiers. If your annual subscribers have significantly higher retention than monthly subscribers, you may want to incentivize annual commitments more strongly.
- Seasonal variations: Compare cohorts who signed up during different seasons or campaign periods. You might discover that customers who join during certain promotions have lower long-term value, indicating you’re attracting price-sensitive users rather than value-oriented ones.
Watch the full podcast episode to learn more:
Identify Upgrade Triggers
Look for patterns in user behavior that consistently precede upgrades. Ashley emphasizes that “being able to get in the data about how people are using the products, when they might have a new problem that you can solve” is crucial for identifying these upgrade opportunities.
She recommends looking for recurring patterns that signal readiness for premium features:
- Feature engagement: If users who engage with your API documentation are 3x more likely to upgrade to your Developer plan, consider making this documentation more accessible and prominently featured.
- Usage thresholds: Track when users approach the limits of their current plan. If most upgrades happen when users reach 80% of their plan usage limits, you can trigger helpful messaging at the 70% mark.
- Team expansion: If adding new seats/users correlates strongly with upgrades, make the team invitation process as frictionless as possible.
Map Feature Usage to Value
Correlate specific feature usage with retention and expansion revenue:
- High-value features: Identify which features are used most frequently by your highest-LTV customers but rarely used by those who churn quickly.
- Engagement sequences: Look for specific sequences of feature adoption that correlate with long-term retention. If users who first set up integrations, then create custom reports, and finally add team members show the highest retention, consider guiding new users through this exact journey.
- Underutilized value-drivers: Find features that deliver high value but see low adoption rates. These represent opportunities for better customer education and onboarding to help them make the most out of these features.

Ashley shares an example from her time at Duarte:
Data from in-person workshop participants consistently showed demand for on-demand content access. This insight led to the creation of an e-course at a different price point, which served multiple business functions simultaneously — providing post-workshop value, generating new leads, and creating an upsell pathway to higher-value services.
Situations like this allow you to “work with product marketing and product management and say, ‘We’re actually seeing signals that there could be an opportunity for a new set of features, capabilities, products, etc. Can you build this for us?’ and bring it back in,” says Ashley.
Look for Intervention Points
Identify the exact moments where different cohorts typically disengage:
- Churn timing: If most churn happens 45 days after signup, you can create targeted interventions at day 30 — before users have mentally committed to leaving.
- Engagement cliffs: Look for sudden drops in feature usage that precede churn. If users who stop logging in for seven consecutive days rarely return, set up re-engagement campaigns that trigger after five days of inactivity.
- Seasonal risk periods: Some cohorts might be more vulnerable during specific times, like fiscal year-end or seasonal business fluctuations.
“Making sure that you understand where there are feature gates, user limits, and how they behave from a buying standpoint” is essential for timing interventions effectively, notes Ashley. According to her, that’s exactly what you should be thinking about to determine which features your audience will likely need.
By systematically working through this framework, you’ll uncover patterns that would be invisible when looking at your customers in aggregate. These insights enable targeted interventions that can significantly boost retention, expansion revenue, and overall customer lifetime value.
The ultimate goal is to identify your highest-value customer segments and optimize everything — from product development to marketing — around acquiring and retaining more of these ideal customers.
Turning Cohort Analysis Insights into Action
Cohort analysis insights are only useful if you put them into practice. Here’s a practical checklist to transform your data discoveries into concrete business improvements:
Pricing Adjustments
- Identify price-sensitive cohorts: Look at conversion rates and churn rates across different acquisition channels. If users from organic search convert at lower rates than referrals, they may be more price-sensitive.
- Test value-based pricing tiers: If cohort analysis reveals that certain customer segments (like Patrick’s security companies) purchase multiple licenses immediately, create bundle pricing that better serves their needs.
- Adjust renewal pricing: If specific cohorts show higher churn at renewal time, consider loyalty discounts or longer-term contracts with better rates.
Onboarding Improvements
- Personalize the onboarding flow: If cohort data shows certain user types struggle with specific features, create tailored onboarding paths for different segments.
- Highlight retention-correlated features: If users who engage with certain features are more likely to remain active, promote these features during onboarding.
- Add intervention points: For cohorts with high early-stage churn, implement check-in emails or in-app messages at crucial moments before users typically drop off.
Feature Prioritization
- Build for high-value cohorts first: If specific customer segments deliver significantly higher LTV, prioritize features that serve their needs, even if they’re a smaller percentage of your user base.
- Eliminate unused features: If your analysis reveals features with minimal usage across all segments, consider removing them to simplify your product.
- Develop upgrade bridges: Create features that solve problems at the exact moment users typically outgrow your basic plan.
Targeted Communication
- Create segment-specific messaging: Use cohort insights to craft different value propositions for different user types, emphasizing the benefits each group cares about most.
- Time your communications strategically: If you find that users typically consider upgrading after 45 days, schedule your premium features email for day 40.
- Re-engage churned cohorts with relevant updates: When you address the reasons specific cohorts left (based on exit surveys), reach out to those users with targeted updates.
Still unsure about this approach? Let’s address — and debunk — some common myths that might be holding you back.
Common Misconceptions About Cohort Analysis
Many software makers avoid cohort analysis because they believe it’s overly complex or requires massive amounts of data. Let’s bust these myths.
“It’s too complicated for non-analysts”
Many developers shy away from cohort analysis, thinking it requires advanced statistical knowledge. In reality, the concept is straightforward: group similar customers together and track how they behave over time.
Modern tools have simplified this process tremendously — like the Freemius Developer Dashboard, which you can see in the section below.
“You need thousands of customers first”
Another common misconception is that cohort analysis only works with large data sets. While more data can reveal subtler patterns, meaningful insights can emerge from even small customer bases.
What matters most isn’t how much data you have, but asking the right questions of the data you do have. Even with just a few dozen customers, grouping them by plan type or acquisition source can reveal critical differences in behavior that lead to actionable insights for your product and marketing strategy.
“It’s a one-time analysis project”
Many believe cohort analysis is something you do once to find insights, and then move on. In reality, it’s most powerful as an ongoing practice.
Customer behavior evolves, especially as your product changes. Regular cohort analysis creates a feedback loop that keeps your product and marketing strategies aligned with your most valuable customers’ evolving needs.
“It’s only useful for reducing churn”
While cohort analysis is excellent for identifying when and why customers leave, limiting it to churn prevention misses its broader potential.
It can reveal which features drive upgrades, which acquisition channels bring your most valuable customers, and even which pricing strategies maximize lifetime value. There are many ways to increase the lifetime value of that customer, from improved onboarding to strategic feature gating — all insights that good cohort analysis can uncover.
How Freemius Makes Cohort Analysis Easy
Freemius transforms complex cohort analysis into a streamlined experience by automatically capturing and visualizing your data in meaningful segments — no spreadsheet expertise required.
Built-In Cohort Analysis Tools
The Freemius Developer Dashboard offers powerful cohort analytics tools right out of the box:
- Date-based cohorts: Filter analytics by customized date ranges to compare performance across different time periods, enabling you to identify seasonal patterns or measure the impact of specific marketing campaigns
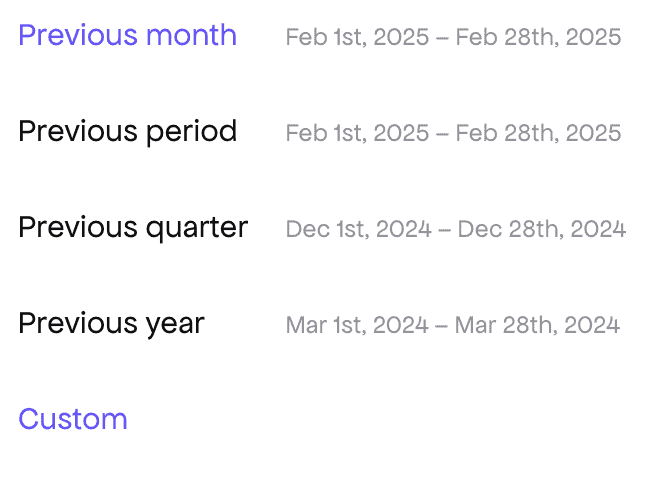
Selecting a time period to analyze the data
- Revenue cohorts: Track metrics like Payments Distributions to identify which customer segments contribute most to your bottom line, using filtering based on customer plan, license, or billing cycle.
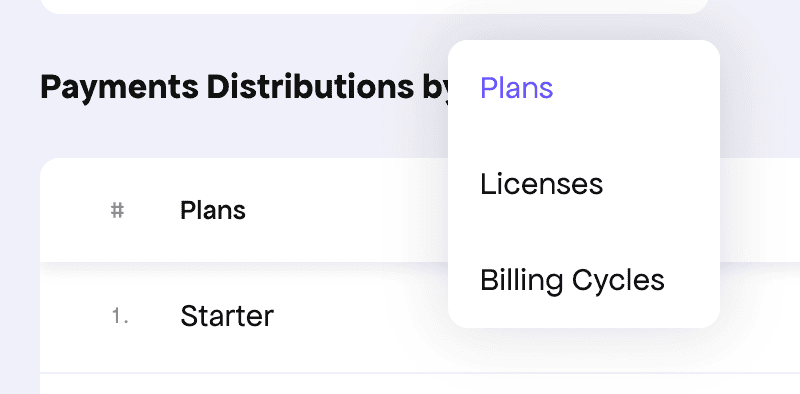
Available filters for Payments distibutions
Here’s an example of what the chart looks like in the dashboard when you compare payments distribution by plans:
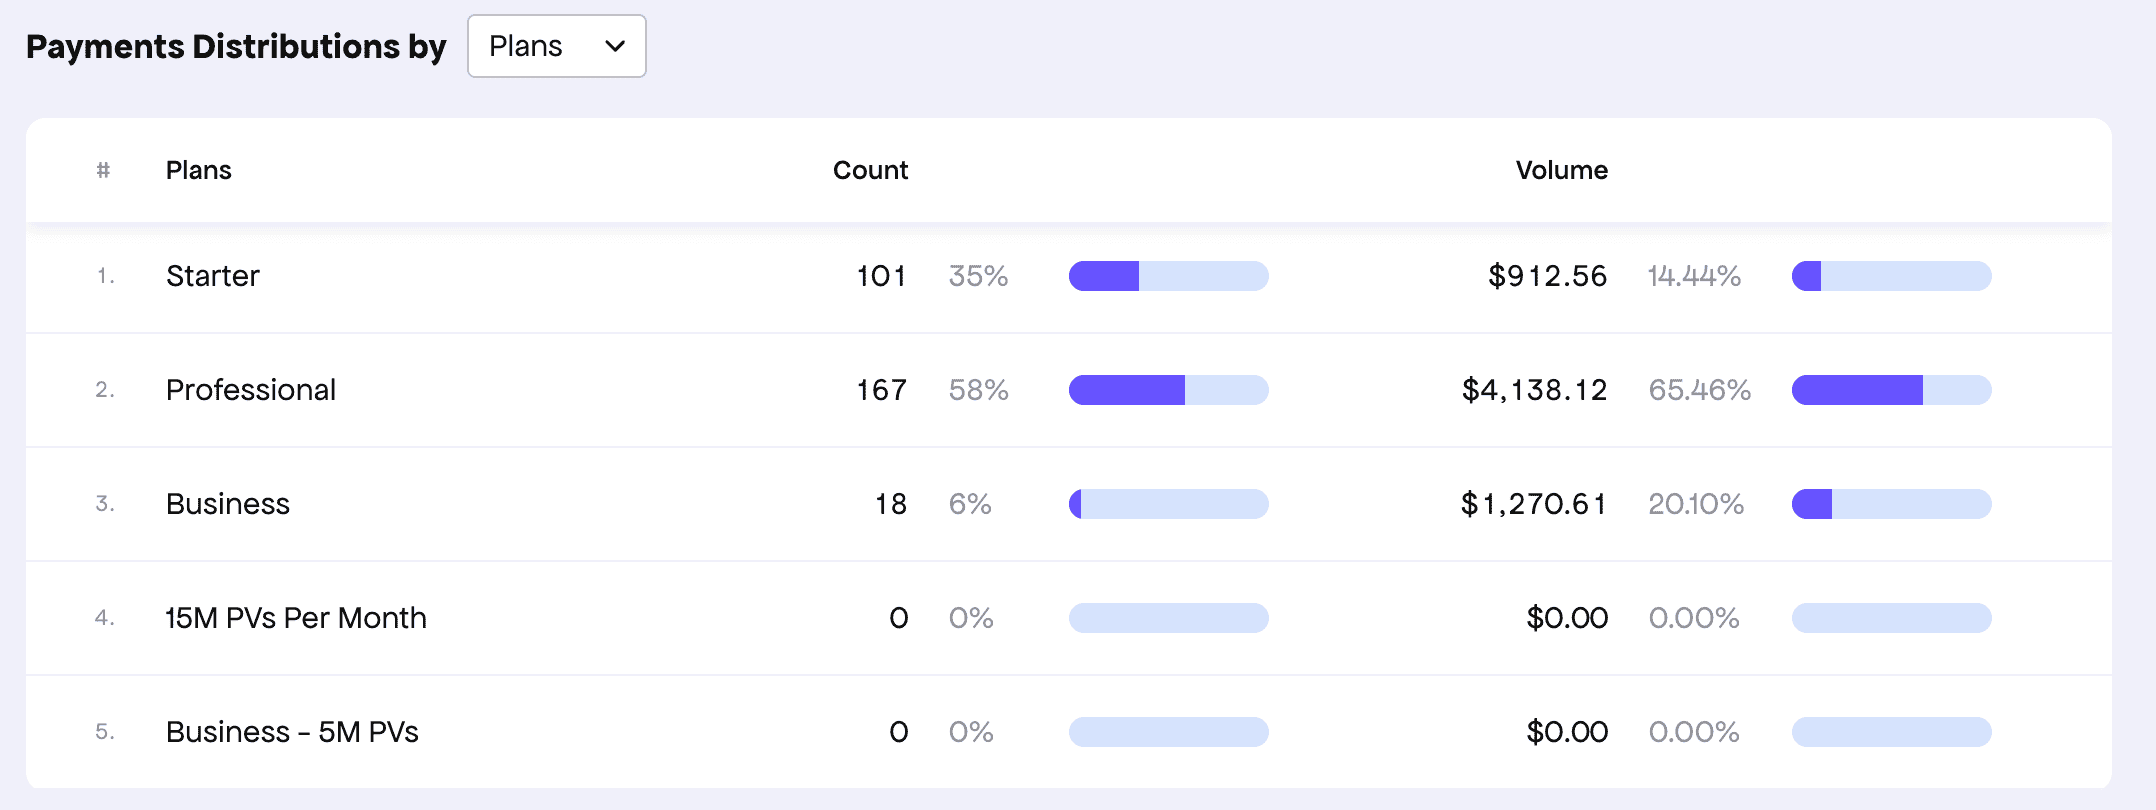
Payments distribution filtered by plans
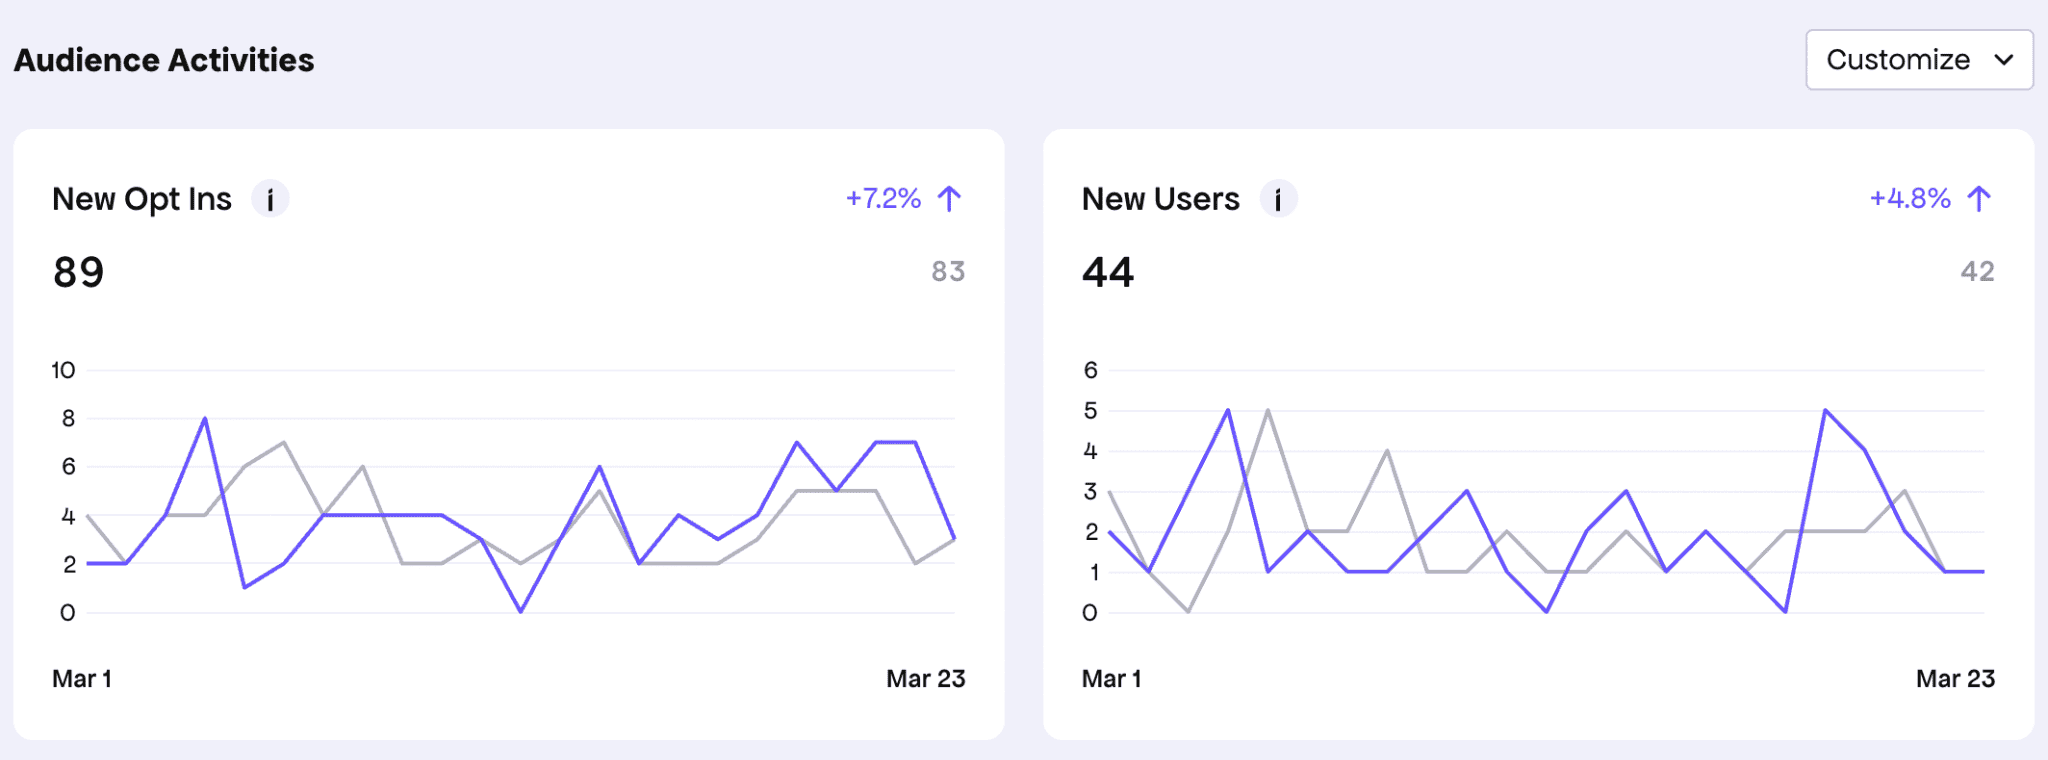
- User behavior segments: Automatically categorize users by activity types, such as active sites, opted-in users, deactivations, and uninstallations, with each metric linking to a deeper filtered view
- Environment cohorts: Analyze usage patterns across WordPress versions, PHP versions, and language preferences through interactive pie charts, helping you prioritize compatibility and localization efforts
This is how Patrick discovered his ideal customer segment: “I filtered for users with more than 10 licenses, then looked deeper at their email addresses to spot patterns.” This simple analysis revealed security companies generated 60% of Patrick’s revenue.
Other than the mentioned cohort, the Developer Dashboard also lets you:
- Use geo-location filtering/analysis of incoming revenues
- Learn how trials impact revenues/conversion rates
- Use currency analysis
- Track average revenue per order (subscription renewals, lifetime purchases, paid trials)
Automated Churn Calculation
Freemius provides powerful tools for cohort-based churn analysis, which is often more insightful for subscription-based businesses than standard churn metrics.
Through the dashboard’s subscription export feature, you can:
- Track churn based on when customers originally subscribed (for instance, following all subscriptions created in January 2024 to see how many remain active after 12 months)
- Compare different types of churn, like subscription churn, customer churn, and revenue churn
- Incorporate trial data through the trial_ends column to accurately calculate conversion rates from trial to paid
- Benchmark your performance against industry standards, including WordPress-specific churn rates for plugins (29% annual), themes (29.3% annual), and bundles (31.1% annual)
Note: If you’re looking to do more in-depth cohort analysis, like cohort-based churn calculation, Freemius supports raw data exports of subscriptions, payments, and customers. This allows you to slice and dice the data manually or using AI, which means you’re not limited by the system’s built-in cohorts.
Optimize Your Revenue Through Cohort Analysis
Cohort analysis transforms how you understand your software business, revealing hidden patterns that directly impact your revenue potential. Instead of treating all customers the same, you gain the ability to see which segments truly drive your business value and how their behavior evolves over time.
The key takeaways from this guide include:
- Cohort analysis isn’t as complex as it may sound
- Different customer groups behave differently
- Early behavior predicts long-term value
- Revenue optimization goes beyond acquisition
Remember that cohort analysis is not a one-time project but an ongoing practice.
Ready to implement cohort analysis in your software business? Take the first step today by examining your existing customer data through the lens of cohorts. The patterns you discover might be the key to doubling your customer lifetime value.